There has been a lot of uncertainty in the economy and the financial markets this year, primarily because the Federal Reserve (Fed) has increased interest rates and is expected to continue to do so to curtail inflation. The financial markets have sold off this year and the worry is that the actions of the Fed could cause a recession which could further impact the stock market. Here is how stocks perform during recessions
The Fed’s action and ensuing recession is not new- there have been 16 recessions in the last 100 years. CLICK HERE for an interactive chart on how the economy and the stock market performed during each of those recessions. What you will conclude from the chart is that the cause of any recession, its duration and how stocks perform during each recession are all very different, making it next to impossible to forecast one let alone make investment decisions based on the forecast. What you also see is that through all these recessions, the stock market has continued to reward patient investors.
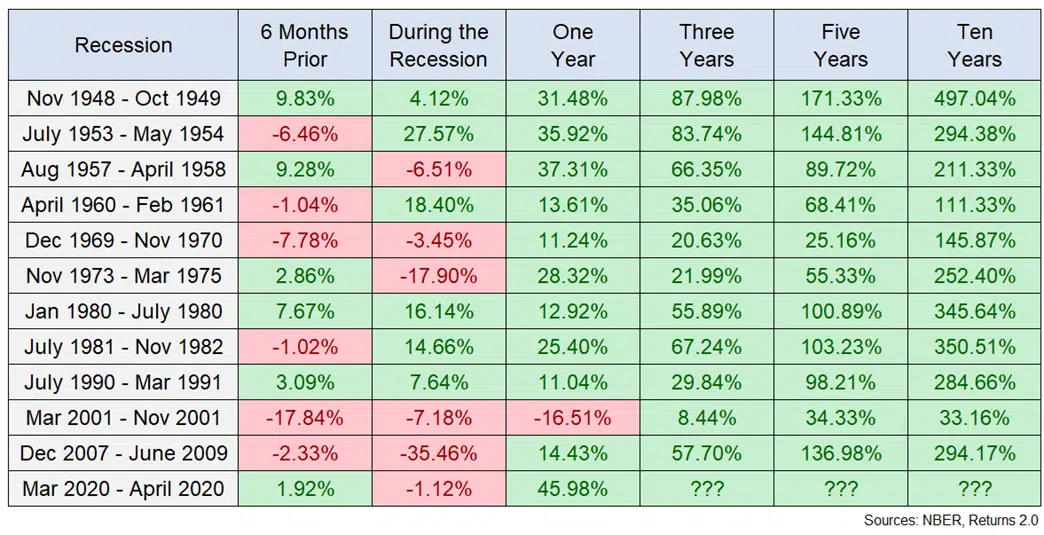
More recently, since World War 2, there have been 12 recessions. The table below shows each of these recessions and the stock market’s (S&P 500) returns 6 months leading up to the recession, during the recession and then one, three, five years and ten years from the end of the recession. As seen, while stocks have performed very differently before and during recessions, over time they have recovered and performed well.
Fig 1: Stocks before, during and after recessions since World War 2