1. A focus on downside protection helps performance over the long term
Research has shown that for most investors the pain of a loss is more acute than the pleasure of an equal gain. There is more to downside protection from an investment strategy point of view: negative returns have a bigger impact on long term performance than positive returns. For example:
-50% followed by +50% ≠ 0%. It is = -25%. (This is also true for +50% followed by -50%)
To drive home the impact of negative returns on long term performance, below is a table illustrating how much and how long it takes to get to breakeven after a negative performance.
Table 1
| Drawdown | Return needed to recoup losses | No. of years to recoup losses at 10% per year |
| -10% | 11.11% | 1.11 |
| -20% | 25.00% | 2.34 |
| -30% | 42.85% | 3.74 |
| -40% | 66.67% | 5.36 |
| -50% | 100.00% | 7.28 |
| -60% | 150.00% | 9.62 |
| -70% | 233.33% | 12.64 |
| -80% | 400.00% | 16.89 |
| -90% | 900.00% | 24.16 |
Source: Sarsi, LLC analysis
It is impossible to avoid negative returns all the time, but by constructing a portfolio that, over the long term captures less of the downside and more of the upside an advisor can add considerable value. To illustrate, even if the adviser reduces the downside as much as he does the upside, he would have added value. Continuing with the above example:
-50% followed by +50% = -25%.
If an adviser reduces both upside and downside by half: -25% followed by +25% = -6.25%
However, as we will see below this objective must be achieved without too much turnover and by not attempting to time the market, which is impossible to do in a consistent and reliable manner. We attempt to mitigate the effect of large protracted drawdowns and participate in large rallies.
2. Market timing is futile
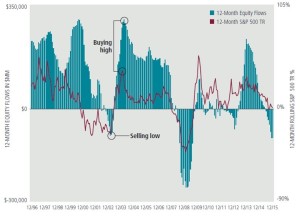
Investors as a group, are terrible at timing the markets. As seen in the figure below, they chase returns, investing in stock funds after markets have reached new highs and selling after markets decline. It takes discipline and a thoughtful, reliable process to avoid falling into this trap.
Fig 1
Source: Illustration by MFS Investment Management
3. It is important to stay invested in the markets
“In risk assets you make 80% of your money 20% of the time”- A Famous Money Manager
It is imperative to be invested in the markets, as missing out a few large moves will make a huge difference to long term returns. The table below shows how an investor would have performed if she had invested in the S&P 500 over the last 5 years and how her return would have been impacted if she had missed some of the months when the S&P 500 had the best returns. Sticking to a strategic allocation based on individual risk profile enables investors to stay invested.
Table 3
| S&P 500 returns last 5 years and if an investor missed the best months | ||
| 5 year annualized return | Value of $100,000 in five years | |
| Invested for all periods | 16.37% | $ 213,387 |
| Missed the best month returns | 13.98% | $ 192,373 |
| Missed the two best months’s returns | 12.15% | $ 177,417 |
| Missed the three best months’s returns | 10.69% | $ 166,166 |
| Missed the four best months’s returns | 9.45% | $ 157,065 |
| Missed the five best months’s returns | 8.35% | $ 149,329 |
Source: Sarsi, LLC analysis
4. A valuation based investment strategy can add value
Ideally, portfolios must be made defensive in advance of market declines. Using a metric like valuation can be an effective way of doing this. As seen in the table below, when markets are expensive, returns in the periods ahead tend to be low. However, this is not a foolproof metric and expensive markets can continue to rally. As the economist John Maynard Keynes noted, markets can remain irrational longer than investors can stay solvent. While it is impossible to get the timing exactly, investors will do well to be defensive when the valuation justifies it, even if it means being early and missing out on the last rally up before a drawdown. The converse is true when markets are cheap. Valuation based tactical allocations around a core strategic allocation enables investors to achieve this objective.
Table 3
| S&P 500 returns in subsequent months/years in %: 03/1926 to 05/2014 | |||||
| Valuation | 6 months | 1 year | 2 years | 3 years | 5 years |
| Above 20% | -0.2 | -3.6 | -1.6 | 6.8 | -0.3 |
| Below 20% | 14 | 19.4 | 30.1 | 47.3 | 65.3 |
| Market | 3.9 | 8 | 16 | 23.6 | 39.7 |
Source: Ned David Research, Sarsi, LLC analysis
5. Investing for the long term increases the odds of positive performance
Most people overestimate what they can achieve in the short term and underestimate what they can achieve in the long term. The same goes for their investing performance. The need for instant gratification and the focus on short-term results leads to investors sacrificing their longer-term performance. By focusing on the long term, investors increase the odds of success and the possibility of realizing their objectives. The table below illustrates how the % of positive performance increases with time frame when looking at the returns of the S&P 500 between 1926 and 2015.
Table 4: S&P 500:1926 to 2015
| S&P 500: 1926 to 2015 | ||
| Time frame | % of periods positive | % of periods negative |
| Daily | 54.00% | 46.00% |
| Quarterly | 68.00% | 32.00% |
| One Year | 74.00% | 26.00% |
| 5 years | 86.00% | 14.00% |
| 10 years | 94.00% | 6.00% |
| 15 years | 100.00% | 0.00% |
Source: Sarsi, LLC analysis
A related point is that to beat a benchmark, one must invest differently from a benchmark, which means there could be underperformance in the short term. Over the long term, ideally one business cycle, a good investment strategy should be able to beat the benchmark.
6. Diversification helps mitigate drawdowns and enhances performance
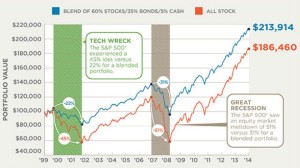
Diversification has been called the ‘free lunch’ that can reduce volatility, protect portfolios from drawdowns and enhance returns. The figure below illustrates this, by considering the period between 1999 to 2015. This period was punctuated by two recessions accompanied by steep market drawdowns. A diversified portfolio of stocks and bonds would have protected investor’s wealth and performed better than an all stock portfolio.
Fig 2
Source: Illustration by Charles Schwab


